# Path2D对象
说明: 从API version 6开始支持。后续版本如有新增内容,则采用上角标单独标记该内容的起始版本。
路径对象,支持通过对象的接口进行路径的描述,并通过Canvas的stroke接口进行绘制。
# addPath
addPath(path: Object): void
将另一个路径添加到当前的路径对象中。
参数:
| 参数 | 类型 | 描述 |
|---|---|---|
| path | Object | 需要添加到当前路径的路径对象 |
示例:
<!-- xxx.mxl -->
<div>
<canvas ref="canvas" style="width: 500px; height: 500px; background-color: #ffff00;"></canvas>
</div>
2
3
4
// xxx.js
export default {
onShow() {
  const el =this.$refs.canvas;
  const ctx = el.getContext('2d');
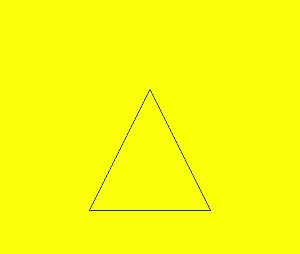
  var path1 = ctx.createPath2D("M250 150 L150 350 L350 350 Z");
  var path2 = ctx.createPath2D();
  path2.addPath(path1);
  ctx.stroke(path2);
}
}
2
3
4
5
6
7
8
9
10
11

# setTransform
setTransform(scaleX: number, skewX: number, skewY: number, scaleY: number, translateX: number, translateY: number): void
设置路径变换矩阵。
参数:
| 参数 | 类型 | 描述 |
|---|---|---|
| scaleX | number | x轴的缩放比例 |
| skewX | number | x轴的倾斜角度 |
| skewY | number | y轴的倾斜角度 |
| scaleY | number | y轴的缩放比例 |
| translateX | number | x轴的平移距离 |
| translateY | number | y轴的平移距离 |
示例:
<!-- xxx.mxl -->
<div>
<canvas ref="canvas" style="width: 200px; height: 150px; background-color: #ffff00;"></canvas>
</div>
2
3
4
// xxx.js
export default {
onShow() {
  const el =this.$refs.canvas;
  const ctx = el.getContext('2d');
  var path = ctx.createPath2D("M250 150 L150 350 L350 350 Z");
  path.setTransform(0.8, 0, 0, 0.4, 0, 0);
  ctx.stroke(path);
}
}
2
3
4
5
6
7
8
9
10
# closePath
closePath(): void
将路径的当前点移回到路径的起点,当前点到起点间画一条直线。如果形状已经闭合或只有一个点,则此功能不执行任何操作。
示例:
<!-- xxx.mxl -->
<div>
<canvas ref="canvas" style="width: 200px; height: 150px; background-color: #ffff00;"></canvas>
</div>
2
3
4
// xxx.js
export default {
onShow() {
  const el =this.$refs.canvas;
  const ctx = el.getContext('2d');
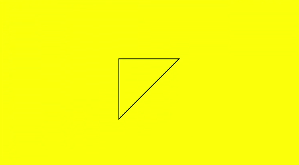
  var path = ctx.createPath2D();
  path.moveTo(200, 100);
  path.lineTo(300, 100);
  path.lineTo(200, 200);
  path.closePath();
  ctx.stroke(path);
}
}
2
3
4
5
6
7
8
9
10
11
12
13

# moveTo
moveTo(x: number, y: number): void
将路径的当前坐标点移动到目标点,移动过程中不绘制线条。
参数:
| 参数 | 类型 | 描述 |
|---|---|---|
| x | number | 目标点X轴坐标 |
| y | number | 目标点Y轴坐标 |
示例:
<!-- xxx.mxl -->
<div>
<canvas ref="canvas" style="width: 300px; height: 250px; background-color: #ffff00;"></canvas>
</div>
2
3
4
// xxx.js
export default {
onShow() {
  const el =this.$refs.canvas;
  const ctx = el.getContext('2d');
  var path = ctx.createPath2D();
  path.moveTo(50, 100);
  path.lineTo(250, 100);
  path.lineTo(150, 200);
  path.closePath();
  ctx.stroke(path);
}
}
2
3
4
5
6
7
8
9
10
11
12
13
# lineTo
lineTo(x: number, y: number): void
从当前点绘制一条直线到目标点。
参数:
| 参数 | 类型 | 描述 |
|---|---|---|
| x | number | 目标点X轴坐标 |
| y | number | 目标点Y轴坐标 |
示例:
<!-- xxx.mxl -->
<div>
<canvas ref="canvas" style="width: 400px; height: 450px; background-color: #ffff00;"></canvas>
</div>
2
3
4
// xxx.js
export default {
onShow() {
  const el =this.$refs.canvas;
  const ctx = el.getContext('2d');
  var path = ctx.createPath2D();
  path.moveTo(100, 100);
  path.lineTo(100, 200);
  path.lineTo(200, 200);
  path.lineTo(200, 100);
  path.closePath();
  ctx.stroke(path);
}
}
2
3
4
5
6
7
8
9
10
11
12
13
14
# bezierCurveTo
bezierCurveTo(cp1x: number, cp1y: number, cp2x: number, cp2y: number, x: number, y: number): void
创建三次贝赛尔曲线的路径。
参数:
| 参数 | 类型 | 描述 |
|---|---|---|
| cp1x | number | 第一个贝塞尔参数的x坐标值。 |
| cp1y | number | 第一个贝塞尔参数的y坐标值。 |
| cp2x | number | 第二个贝塞尔参数的x坐标值。 |
| cp2y | number | 第二个贝塞尔参数的y坐标值。 |
| x | number | 路径结束时的x坐标值。 |
| y | number | 路径结束时的y坐标值。 |
示例:
<!-- xxx.mxl -->
<div>
<canvas ref="canvas" style="width: 200px; height: 150px; background-color: #ffff00;"></canvas>
</div>
2
3
4
// xxx.js
export default {
onShow() {
  const el =this.$refs.canvas;
  const ctx = el.getContext('2d');
  var path = ctx.createPath2D();
  path.moveTo(10, 10);
  path.bezierCurveTo(20, 100, 200, 100, 200, 20);
  ctx.stroke(path);
}
}
2
3
4
5
6
7
8
9
10
11
# quadraticCurveTo
quadraticCurveTo(cpx: number, cpy: number, x: number, y: number): void
创建二次贝赛尔曲线的路径。
参数:
| 参数 | 类型 | 描述 |
|---|---|---|
| cpx | number | 贝塞尔参数的x坐标值。 |
| cpy | number | 贝塞尔参数的y坐标值。 |
| x | number | 路径结束时的x坐标值。 |
| y | number | 路径结束时的y坐标值。 |
示例:
<!-- xxx.mxl -->
<div>
<canvas ref="canvas" style="width: 200px; height: 150px; background-color: #ffff00;"></canvas>
</div>
2
3
4
// xxx.js
export default {
onShow() {
  const el =this.$refs.canvas;
  const ctx = el.getContext('2d');
  var path = ctx.createPath2D();
  path.moveTo(10, 10);
  path.quadraticCurveTo(100, 100, 200, 20);
  ctx.stroke(path);
}
}
2
3
4
5
6
7
8
9
10
11
# arc
arc(x: number, y: number, radius: number, startAngle: number, endAngle: number, anticlockwise: number): void
绘制弧线路径。
参数:
| 参数 | 类型 | 描述 |
|---|---|---|
| x | number | 弧线圆心的x坐标值。 |
| y | number | 弧线圆心的y坐标值。 |
| radius | number | 弧线的圆半径。 |
| startAngle | number | 弧线的起始弧度。 |
| endAngle | number | 弧线的终止弧度。 |
| anticlockwise | boolean | 是否逆时针绘制圆弧。 |
示例:
<!-- xxx.mxl -->
<div>
<canvas ref="canvas" style="width: 200px; height: 150px; background-color: #ffff00;"></canvas>
</div>
2
3
4
// xxx.js
export default {
onShow() {
  const el =this.$refs.canvas;
  const ctx = el.getContext('2d');
  var path = ctx.createPath2D();
  path.arc(100, 75, 50, 0, 6.28);
  ctx.stroke(path);
}
}
2
3
4
5
6
7
8
9
10
# arcTo
arcTo(x1: number, y1: number, x2: number, y2: number, radius: number): void
依据圆弧经过的点和圆弧半径创建圆弧路径。
参数:
| 参数 | 类型 | 描述 |
|---|---|---|
| x1 | number | 圆弧经过的第一个点的x坐标值。 |
| y1 | number | 圆弧经过的第一个点的y坐标值。 |
| x2 | number | 圆弧经过的第二个点的x坐标值。 |
| y2 | number | 圆弧经过的第二个点的y坐标值。 |
| radius | number | 圆弧的圆半径值。 |
示例:
<!-- xxx.mxl -->
<div>
<canvas ref="canvas" style="width: 200px; height: 150px; background-color: #ffff00;"></canvas>
</div>
2
3
4
// xxx.js
export default {
onShow() {
  const el =this.$refs.canvas;
  const ctx = el.getContext('2d');
  var path = ctx.createPath2D();
  path.arcTo(150, 20, 150, 70, 50);
  ctx.stroke(path);
}
}
2
3
4
5
6
7
8
9
10
# ellipse
ellipse(x: number, y: number, radiusX: number, radiusY: number, rotation: number, startAngle: number, endAngle: number, anticlockwise: number): void
在规定的矩形区域绘制一个椭圆。
参数:
| 参数 | 类型 | 描述 |
|---|---|---|
| x | number | 椭圆圆心的x轴坐标。 |
| y | number | 椭圆圆心的y轴坐标。 |
| radiusX | number | 椭圆x轴的半径长度。 |
| radiusY | number | 椭圆y轴的半径长度。 |
| rotation | number | 椭圆的旋转角度,单位为弧度。 |
| startAngle | number | 椭圆绘制的起始点角度,以弧度表示。 |
| endAngle | number | 椭圆绘制的结束点角度,以弧度表示。 |
| anticlockwise | number | 是否以逆时针方向绘制椭圆,0为顺时针,1为逆时针。(可选参数,默认为0) |
示例:
<!-- xxx.mxl -->
<div>
<canvas ref="canvas" style="width: 500px; height: 450px; background-color: #ffff00;"></canvas>
</div>
2
3
4
// xxx.js
export default {
onShow() {
  const el =this.$refs.canvas;
  const ctx =el.getContext('2d');
  var path = ctx.createPath2D();
  path.ellipse(200, 200, 50, 100, Math.PI * 0.25, Math.PI * 0.5, Math.PI, 1);
  ctx.stroke(path);
}
}
2
3
4
5
6
7
8
9
10
# rect
rect(x: number, y: number, width: number, height: number): void
创建矩形路径。
参数:
| 参数 | 类型 | 描述 |
|---|---|---|
| x | number | 指定矩形的左上角x坐标值。 |
| y | number | 指定矩形的左上角y坐标值。 |
| width | number | 指定矩形的宽度。 |
| height | number | 指定矩形的高度。 |
示例:
<!-- xxx.mxl -->
<div>
<canvas ref="canvas" style="width: 500px; height: 450px; background-color: #ffff00;"></canvas>
</div>
2
3
4
// xxx.js
export default {
onShow() {
  const el =this.$refs.canvas;
  const ctx = el.getContext('2d');
  var path = ctx.createPath2D();
  path.rect(20, 20, 100, 100);
  ctx.stroke(path);
}
}
2
3
4
5
6
7
8
9
10